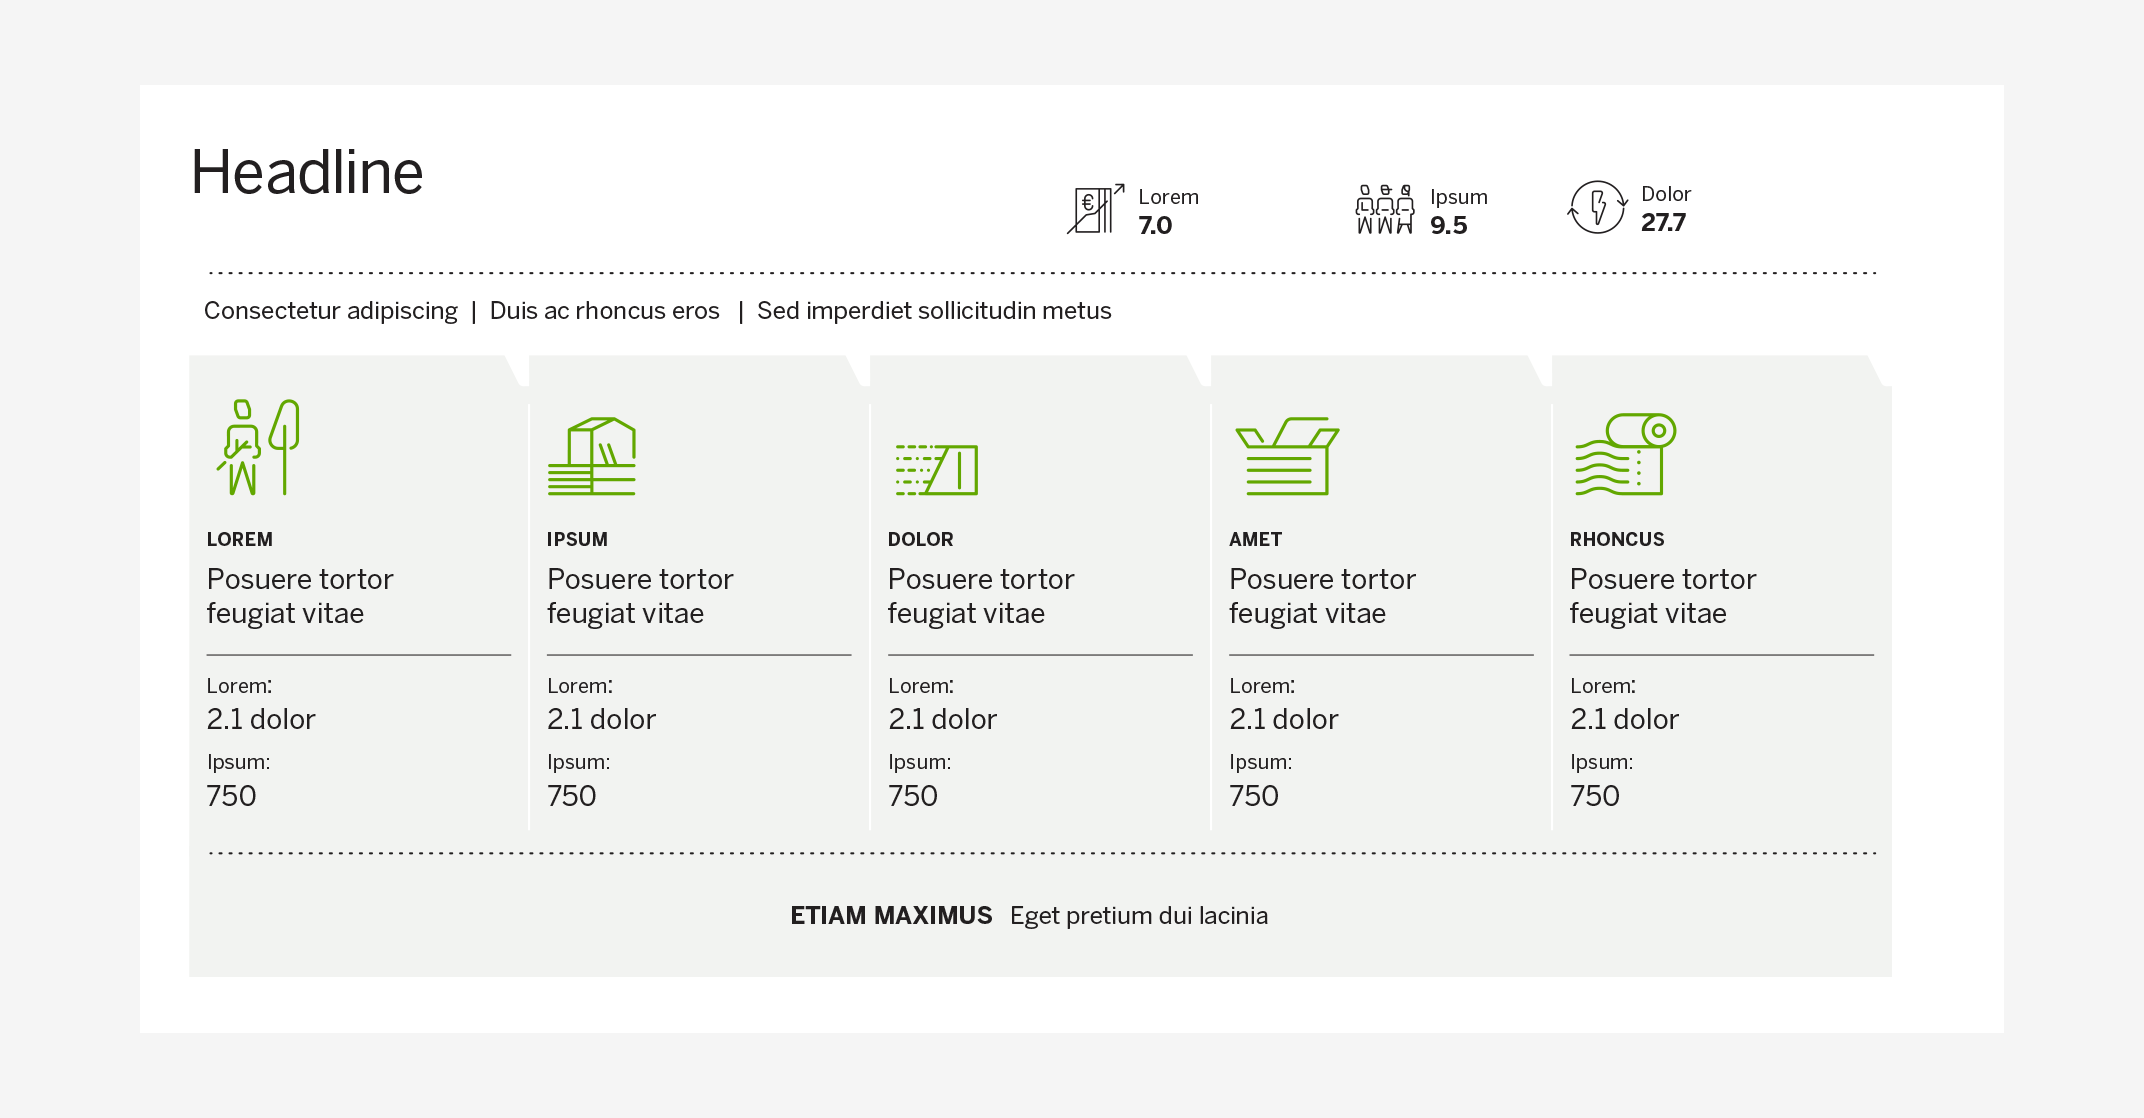
The organization of information is a crucial part of Metsä Group's visual identity. Our information graphics include specifications for the use of pictograms, illustrations, charts and tables.

Information graphics

Pictograms
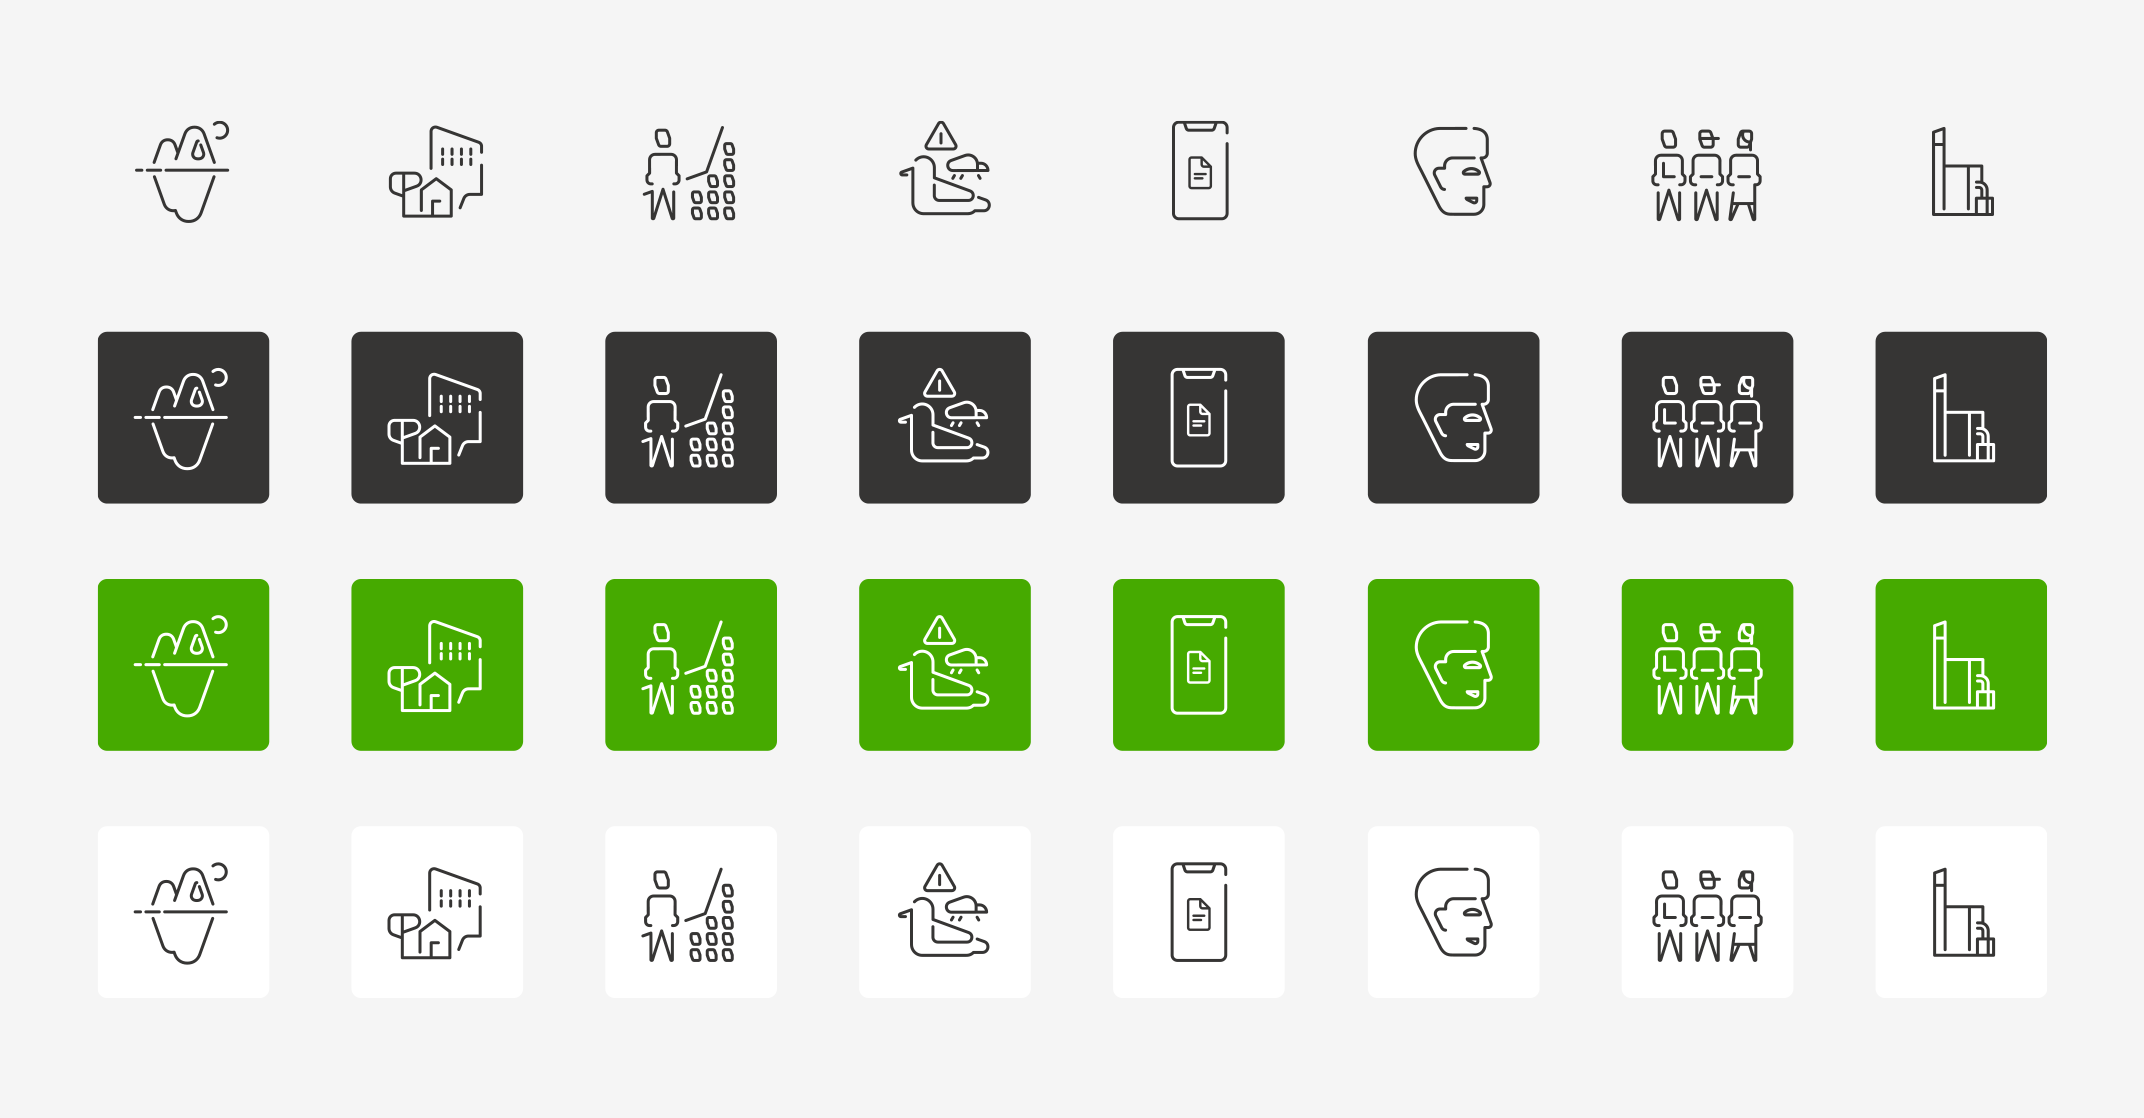
The primary purpose of pictograms is to convey meaning quickly and universally regardless of language or cultural barriers.
The primary colours used in pictograms are tuhka or white. Other Metsä Group colours can be used for specific needs. It is recommended to use the pictograms without a holding shape. If necessary, a defined square with rounded corners may be applied.

Tabular or statistical data
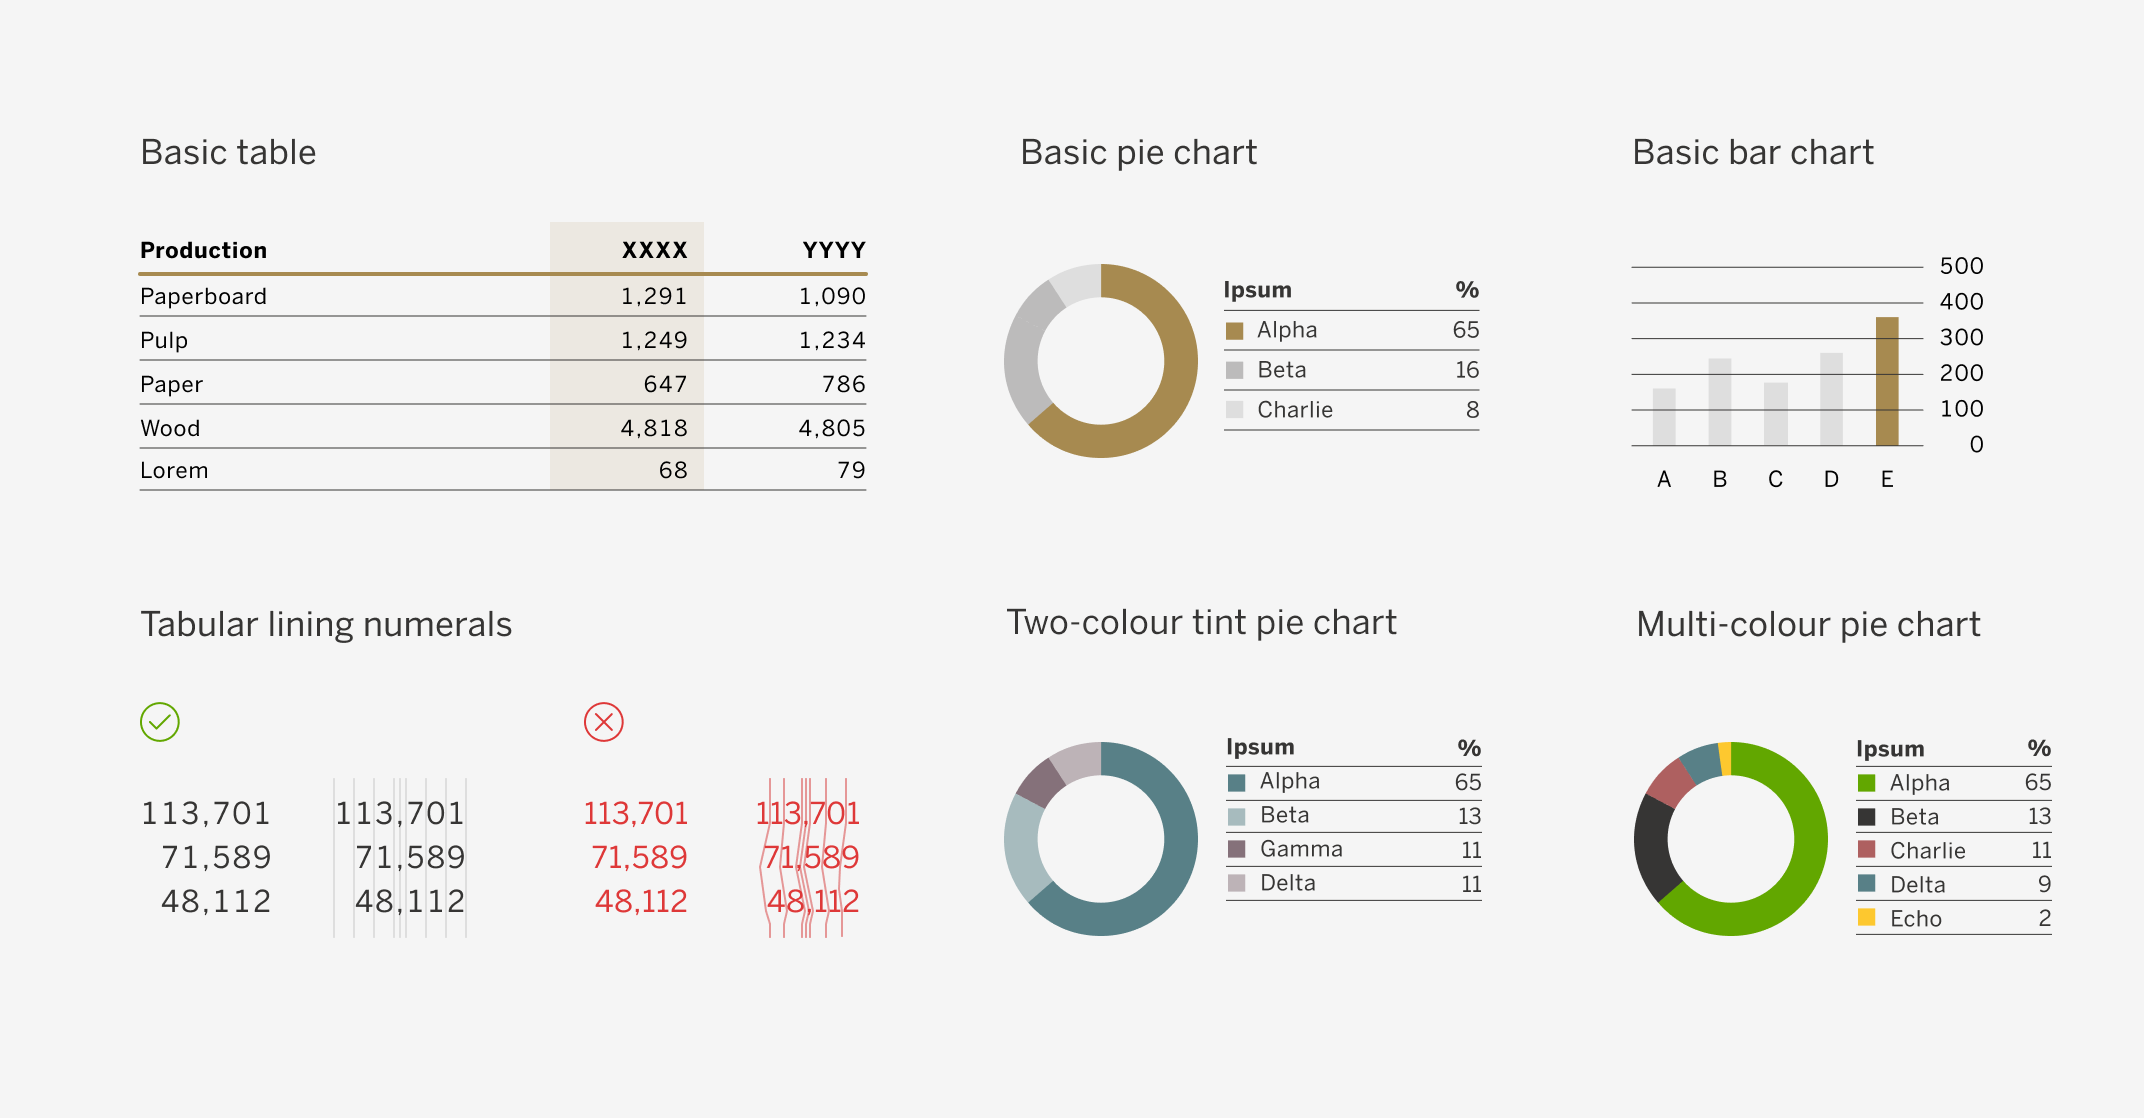
Tabular data should be reduced to a bare minimum to ensure consistency and clarity. Colour should be used functionally to group similar entities together on the same visual surface / section. Numerals should be typeset with tabular monospaced style.

Want to read more?
A pdf version of the guidelines can be downloaded from the following link in case you need a printer-friendly off-line hard copy of the guidelines.


